12 Top Property Management KPIs for Managers in 2025
October 28, 2025
.avif)
Quick Summary
This guide highlights 12 key property management KPIs, including net operating income, occupancy rate, expense ratio, and other real estate performance metrics. Learn how to calculate KPIs and see how Revela’s automated dashboards and reconciled accounting simplify KPI tracking for decision-making.
Want to Measure Progress on Management Goals?
‘Selecting the right measure and measuring things right are both art and science. And KPIs influence management behaviour as well as business culture.’
—Pearl Zhu, Business Author
Property Management KPIs (Key Performance Indicators) are essential to all stakeholders—from managers to owners and investors. These metrics help managers measure and demonstrate operational efficiency, while providing owners and investors with data to make informed business decisions.
This Revela guide highlights 12 key Property Management KPIs to track in 2026 and how Revela’s automated, centralized systems improve outcomes.
Why Listen To Us?
At Revela, we leverage years of property management experience and advanced accounting technology to help managers track KPIs with data-driven insights. Our platform automates reconciliations, centralizes reporting, and delivers real-time insights that impact key performance indicators.
This guide is built on our experience helping customers turn trust accounting solutions and data-led insights into measurable progress and stronger portfolio performance.
What are Property Management KPIs?
In simple terms, property management KPIs are performance metrics used to determine how well a property, portfolio, or management team is meeting its objectives. They provide measurable values to track the success of essential operations, including rent collection, maintenance, and tenant satisfaction.
Property managers, owners, and investors use these KPIs at various levels to assess performance, identify areas for improvement, and track progress toward business goals like profitability and operational efficiency.
Many property management KPIs offer valuable insights. You must identify the KPIs that best align with your specific operations and targets — then review, adjust, or refine them regularly to fit evolving business conditions.
Classes of Property Management KPIs
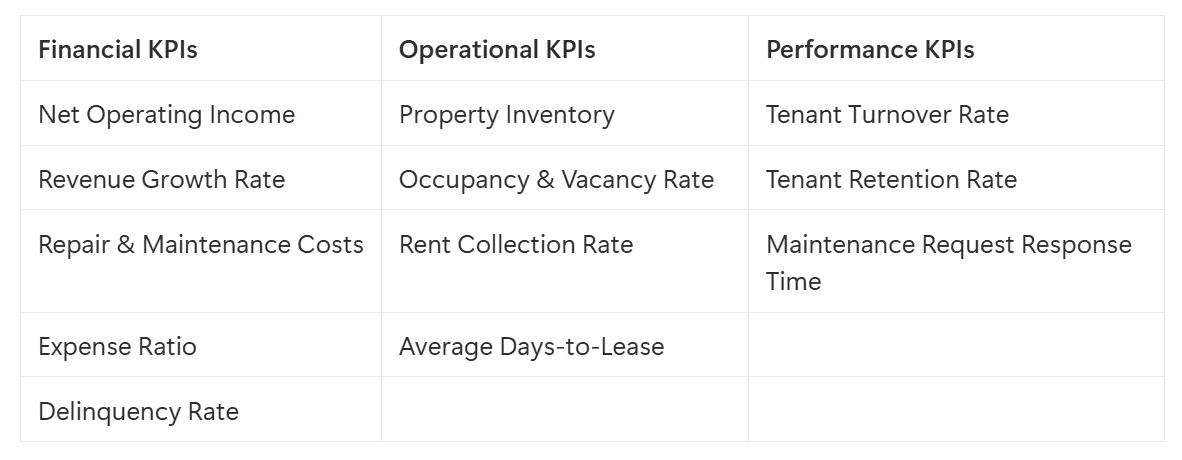
The vast majority of property management KPIs can be categorised into three groups:
- Financial KPIs: Performance metrics that measure profitability, cost management, and the overall health of business finances
- Operational KPIs: These metrics track how effective and efficient your property management processes are.
- Performance KPIs: These are a wider measure of how successful your management is, taking into account client and tenant satisfaction
We have identified the key KPIs within each category that can drive the growth and success of your property portfolio. Let’s take a closer look at them below.
12 Effective, Actionable KPIs and How To Calculate Them
1. Net Operating Income
Net income represents the actual profit your property generates after subtracting all operational expenses from your total earnings. Total earnings encompass various revenue streams, including rent, late fees, and service charges for amenities like parking spaces and storage lockers.
This KPI reveals whether your property management operations are financially viable after accounting for all expenses. You can also break this figure down to determine profitability per unit, which shows how much each resident contributes to—or takes from—your overall revenue.
KPI Formula:
- Net Operating Income = Earnings - Operating Expenses
2. Revenue Growth Rate
Revenue growth as a KPI tracks how your business performs year over year, highlighting areas of strength and opportunities for improvement. When your management strategies are effective, you’ll likely see consistent increases in annual revenue.
However, if revenue growth declines, it shows the need to re-examine your business performance and identify where income is dropping. This could result from rent prices not keeping up with inflation, a higher rate of vacancies, or investments you’ve made in property improvements that have yet to yield returns.
KPI Formula:
- Revenue Growth Rate = (This year’s revenue - last year’s revenue) / previous year’s revenue x 100
3. Repair & Maintenance Costs
Repair and maintenance costs make up a significant chunk of property management expenses. Tracking these costs over time helps you identify patterns of overspending.
Sometimes, certain repairs may be unnecessary, or it may be worth getting a second opinion to compare pricing and secure more competitive rates. You can also explore other ways to cut costs, such as bulk service contracts or energy-efficient upgrades that lower long-term expenses.
KPI Formula:
- Average Maintenance Costs = Total Maintenance Costs / Total Number of Units
4. Expense Ratio
The expense ratio measures the percentage of your total income that goes towards operating costs, such as management fees, labor, maintenance, repairs, and capital expenditures (large expenses that don’t happen often, i.e., HVAC replacement). If it goes beyond 40% of your gross income, you’re probably spending more than you should.
This KPI enables you to compare the operational costs of different properties and identify the most profitable option. A lower expense ratio means better returns for owners, investors, and managers.
KPI Formula:
- Expense Ratio: (Total Operating Expense / Gross Operating Income) × 100
5. Delinquency Rate
Tenant delinquency refers to the number of residents who are behind on rent payments. This metric helps determine the effectiveness of your rent collection processes.
If you have a high delinquency rate, consider revising your tenancy requirements and screening process to ensure your residents understand your policies regarding overdue payments. Also, consider that a high delinquency rate might point toward flaws or complexity in your payment systems.
KPI Formula:
- Tenant Delinquency Rate = (Number of Tenants Behind on Rent ÷ Total Number of Tenants) × 100
6. Property Inventory
This operational KPI enables managers to monitor the cumulative growth of their portfolio by tracking the number of properties acquired and lost within a year. By monitoring property inventory, you can refine business practices to enhance customer retention.
Having a higher acquisition rate ensures a consistent stream of income, but it’s also important to learn why you’ve lost some properties. Are your competitors offering more value? Do your processes still support your target investors?
KPI Formula:
- Property Inventory = Total Properties Acquired - Total Properties Lost
7. Occupancy & Vacancy Rate
This KPI shows how properties in your portfolio are performing compared to the market average. In most urban areas, occupancy rates can come up to 95%, while rural areas might see slightly lower figures due to low rental demand.
Vacant properties still require upkeep even though they don’t generate any revenue, so it’s essential to modify your offerings and strategies to improve tenant retention. If your occupancy rate is higher than the market average and you offer competitive rents, that’s a strong selling point when pitching to prospective investors.
KPI Formula:
- Occupancy Rate (%) = (Number of Occupied Units / Total Number of Units) x 100
- Vacancy Rate (%) = (Number of Vacant Units / Total Number of Units) x 100
8. Rent Collection Rate
Rent collection rate is a financial KPI that measures how efficiently your team collects rent within each billing period. It is an important metric because rent payments directly affect your revenue and cash flow.
A high rent collection rate indicates effective management practices and collection strategies, while a low rate points to underlying issues that need attention. Factors such as payment systems, tenant satisfaction, and overall economic conditions can impact rent collection rates.
KPI Formula:
- Rent Collection Rate = (Total Rent Collected on Time / Total Rent Due) × 100%
9. Average Days-to-Lease
Every day an apartment unit stays vacant, money is slipping through your fingers. Average Days-to-Lease measures how long it takes your units to move from vacancy to occupancy, and a shorter average time shows investors that your resident acquisition costs are lower.
If your units are taking too long to lease, cutting rent below market prices isn’t the answer. Instead, focus on improving your marketing efforts by providing clear information in listings, using high-quality photos, responding to applicants promptly, and offering guided showings.
KPI Formula:
- Average Time to Lease = Total Days Vacant for All Leased Units (within a fixed period) / Total Number of Leased Units (during the same period)
10. Maintenance Request Response Time
This KPI refers to the average time it takes your team to respond to or complete a maintenance request. A reasonable response time ranks high on residents’ list of priorities and improves their experience.
Long response times often indicate outdated processing systems that rely on calls or emails, which can be inefficient. Modern property management software, such as Revela, offers centralized portals that streamline tenant communication and vendor management.

KPI Formula:
- Maintenance Request Response Time = Total Time Taken to Resolve Requests (days or hours) / Total Number of Requests
11. Tenant Turnover Rate
Every time a tenant vacates your property, you incur costs for maintenance, rent readiness, and marketing. Tenant Turnover (Unit Churn) is a key KPI for property managers because it reveals how often you’re losing tenants—and why.
It’s normal for tenants to move out every year or two, especially in smaller units. However, if your tenant turnover rate is often higher than the market average, it may point to issues such as mismanagement, poor communication, or low tenant satisfaction.
KPI Formula:
- Tenant Turnover Rate = (Number of Units Vacated / Total Number of Units) x 100
12. Tenant Retention Rate
Tenant retention (or renewal) rate is a measure of how many tenants have renewed their leases in a fixed period of time. It is a metric that helps property managers visualize the stability of their income and shows that tenants are happy with their experience.
A high retention rate eliminates turnover costs and increases revenue. If you have low retention rates, there may be issues with your property conditions or management processes.
KPI Formula:
- Tenant Retention Rate = (Total Number of Renewed Leases / Total Number of Expiring Leases) × 100
NOTE: The exact metrics you select can impact what organizational goals and objectives you center on throughout the year.
Best Practices To Improve KPI Results (With Revela)
To improve your KPI results, you must set the right KPIs and measure them accurately. The best way to do this is with modern property management software.
Revela is an all-in-one property management accounting software that combines advanced technology with accounting expertise to deliver accurate trust accounting, automated reconciliations, and real-time reporting.
Compared to other property management software, Revela’s unified system significantly simplifies how managers track, measure, and analyze KPIs. It automatically syncs operational and financial data, eliminating the time and errors associated with manual data entry.
Here are three ways you can ensure your KPIs contribute to growth:
1. Choose Actionable KPIs
Assess your organizational objectives and highlight specific, measurable short-term goals. Choose actionable KPIs that allow you to track your progress toward each target.
For example, a property manager’s short-term goal might be to reduce operating costs by 5 to 10% within the next quarter. A KPI like Net Operating Income, measured monthly, will show trends that indicate whether the manager’s cost control efforts are working.
2. Use Property Management Software
Here are key ways Revela improves KPI tracking and outcomes:
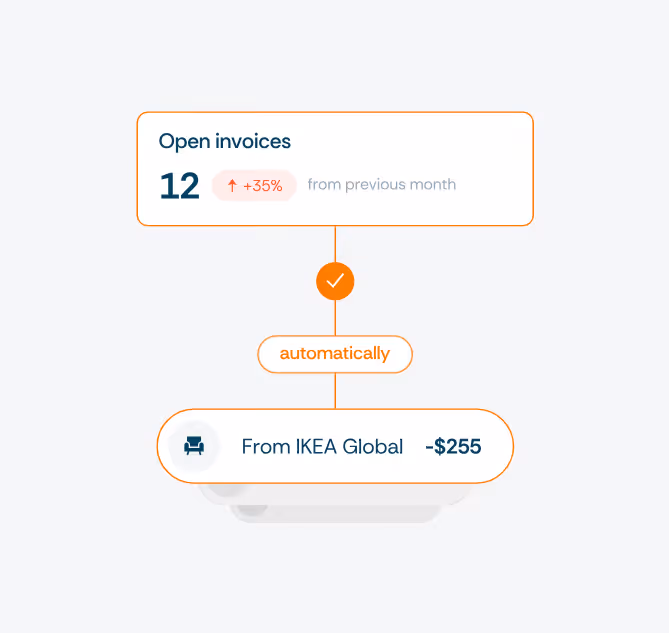
Automated Reconciliation
It matches total business income and expenses against bank records in real-time to give property managers an accurate picture of their finances. This makes it easy to calculate metrics like net income or repair and maintenance costs without the hassle of spreadsheets and manual calculations.
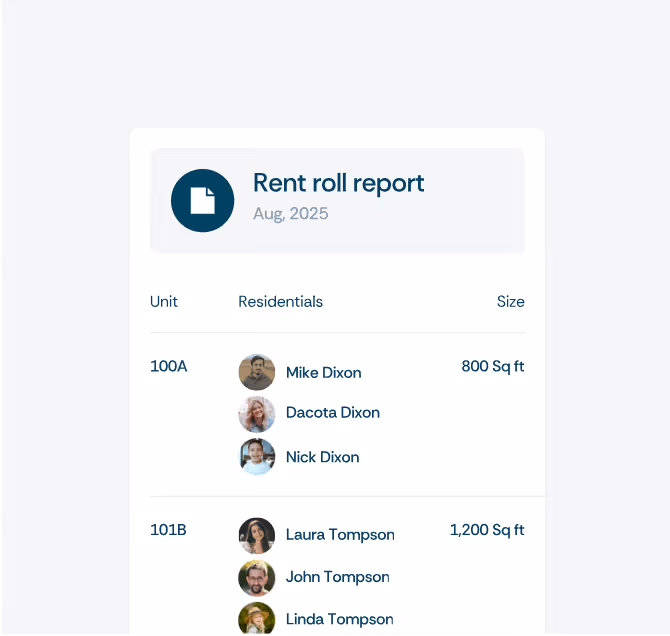
Centralized Dashboards
Revela centralizes tenant, lease, and maintenance data on a single dashboard, enabling managers to automatically track key metrics, including occupancy rates, maintenance response times, and tenant turnover.
Integrated Data Analytics
Revela’s dashboard provides automatic, visual data reporting, enabling managers to visualize trends at a glance, assess performance, and make informed decisions without switching between tools. It delivers consistent, structured financial data insights that make KPI tracking both faster and more reliable.
Property, Portfolio & Entity-Level Accounting
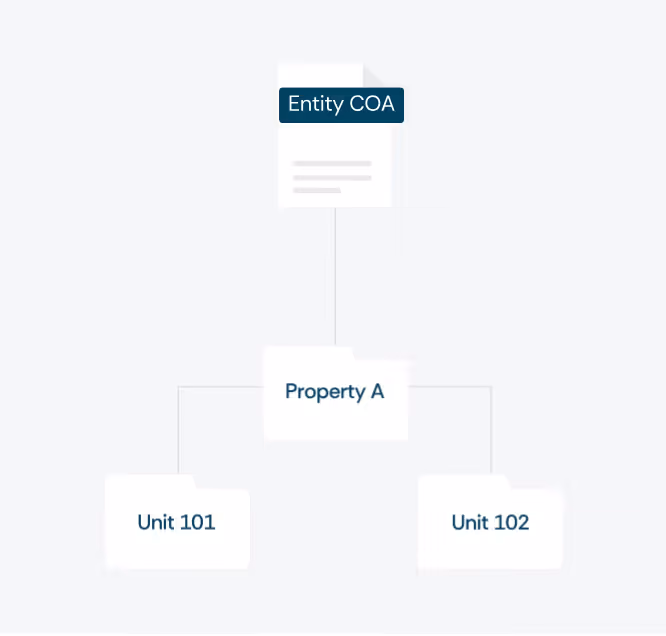
Revela enables you to customize your property management chart of accounts (COA) to match the needs of your clients. You can roll up financial data for your whole portfolio or zoom in on data for individual assets. This flexibility ensures that your KPIs reflect accurate financial performance across every level.
3. Schedule Performance Reviews
Carry out regular performance reviews to evaluate portfolio trends, measure progress toward goals, and identify the causes of variation. These reviews will help you identify opportunities to refine your KPIs, ensuring they stay aligned with your objectives and adapt to any changes in your management processes.
Optimize Property Management KPIs With Revela
Property Management KPIs are more than just numbers; they are a roadmap for growth and data-led decision-making. However, you need accurate, consistent, and timely data to track these metrics.
At Revela, we’ve built an integrated property management platform that gives property managers full visibility into their financial and operational data. With Revela, you get:
- GAAP-compliant trust accounting
- Automatic reconciliations
- Real-time insights
- Centralised dashboards
Book a free demo to see how Revela’s unified accounting and reporting make KPI tracking accurate and actionable.